

Try cloud services
CREODIAS offers a cloud computing solutions for EO data processing.

Copernicus Data Space Ecosystem becomes the main Copernicus endpoint
Copernicus Open Access Hub ceases operations at the end of October 2023.

Article:
Summary of observation scenarios of Sentinel satellite missions.
Technical webinar
24 April, 2pm, CEST
Join our webinar to learn step by step how to start using CloudFerro cloud resources.
Latest CREODIAS statistics
67 PB EODATA size
26 TB data daily growth
99,9% API availability

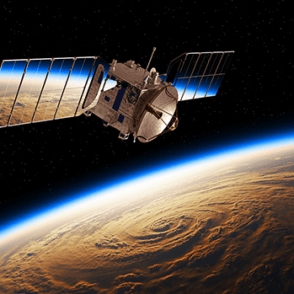
The connection of
Earth and Space
Open and free Earth Observation (EO) data, immediately available online. Access to
big collections of Copernicus data with rich access interfaces.


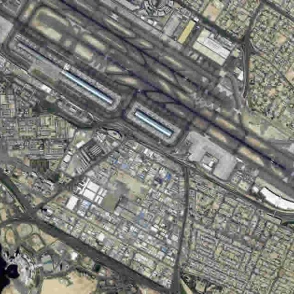
Higher resolution means more precision
Explore our range of VHR (very high resolution) optical and radar imagery
from multiple sources.


Cloud environment
Do you need reliable and high-performance cloud computing? Take a look at the offer and check out its capabilities.


Access and processing simplicity.
We provide a wide range of tools and software for projects using
Earth Observation data
All big solutions started from Data

Cloud storage
We provide unique cloud storage solutions. Various types of spaces ensure complete adaptation to your needs and a clear price list allows for an easy cost prediction. Our solutions were selected by the European Space Age…

Computing environment
CloudFerro’s clients obtain an efficient environment for data computation. Our public cloud is a complete and scalable large-scale computing environment, which allows for quick construction of complex systems…

User tools
CREODIAS is a public cloud with an integrated repository of satellite images, equipped with a range of applications allowing users to search, view, and process satellite products. The architecture of the environment gives use…

Remote transfer for EO data
The remote transfer for EODATA service enables connecting with CREODIAS repository from an external infrastructure via S3 protocol.

S2 SCENES
This image is generated automatically via S2 Scenes, a sample DIAS Front-Office application.
For more information, use links below.
Observation date: 2021-04-22 13:32:19; Location: Brazil, South America
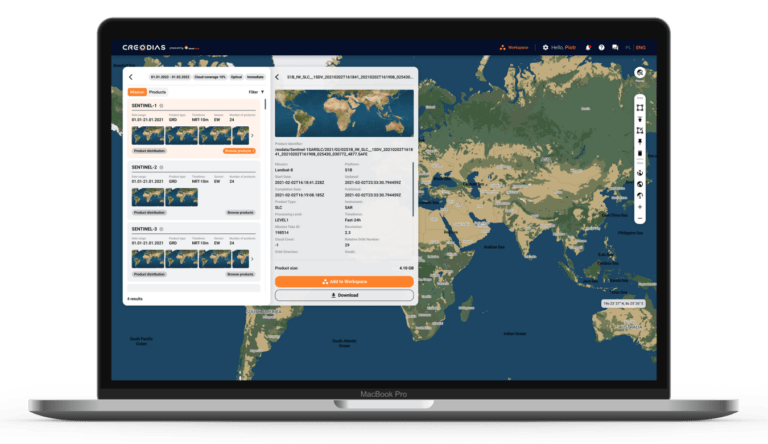
Data Explorer
User friendly tool for searching, browsing and processing satellite data, that reduces the workload required to incorporate this data into the production process.
Processing center
Product Generation as a Service (PGaaS) is a serverless processing service, which allows easy mass processing of EO products without using virtual machines.

Get more information on data and use cases

Processing Sentinel-5P data using HARP and Python
Air quality is a crucial factor that impacts public health. Thanks to the satellite observations provided by TROPOMI onboard Senitnel-5P, hotspots of nitrogen dioxide (NO2) can be detected over the Earth every day. However, Sentinel-5P data needs to be prepared in a proper way to be useful for further analysis.

EO Data Access (R)evolution
Earth Observation (EO) produces a massive amount of data (34 PB available on CREODIAS) that needs to be archived and made accessible to end-users. Operational costs of maintaining Immediately Available Data (IAD) were cumbersome for many data platforms operating at a large scale such as the Copernicus Open Access Hub.

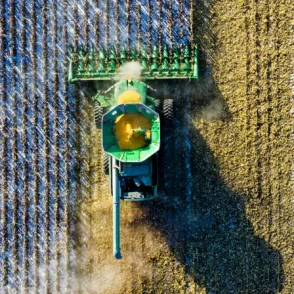
Satellite remote sensing analysis of the forest
In order to talk about remote sensing analysis of the forest, we must first define what a forest is. We encounter the first problem here as the definition of the forest is not uniform. There are more than two hundred definitions of this word worldwide, which, of course, complicates the matter as the spatial scale of the analysis increases, and at the same time, it means that remote sensing data can sometimes be used in a limited way.
Sign up to our Newsletter
Do you want to receive additional information about products, services, tools and upcoming events?
Stay up to date with the latest news, trends and upcoming events. Sign up for our newsletter.